The main source of background originates from photoproduction events.
Figure 3 shows the distribution of DIS and
photoproduction events in a given x and Q2 bin
after all cuts, except for the cut on ![]() , have been applied.
To calculate the number of photoproduction events with
, have been applied.
To calculate the number of photoproduction events with ![]() GeV
a fit is made to the data, shown as black dots, in each bin of the x-Q2
plane. From the total number of events in each bin, the number of
photoproduction events as calculated from the fit, is subtracted.
The photoproduction background can rise to 12% at high y, but is
a few percent for most of the bins.
Other sources of background, like cosmic ray events and halo muons,
contribute much less and are efficiently removed.
GeV
a fit is made to the data, shown as black dots, in each bin of the x-Q2
plane. From the total number of events in each bin, the number of
photoproduction events as calculated from the fit, is subtracted.
The photoproduction background can rise to 12% at high y, but is
a few percent for most of the bins.
Other sources of background, like cosmic ray events and halo muons,
contribute much less and are efficiently removed.
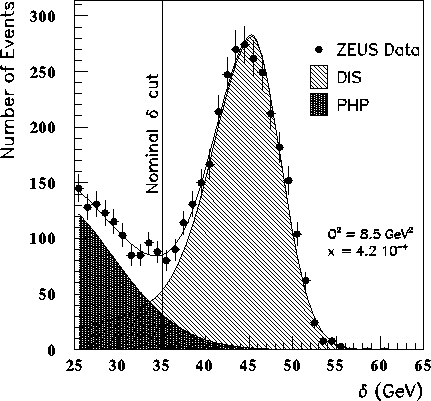
Figure 3: Distribution of DIS and photoproduction (php) events in a given x-Q2 bin. The black dots show the data and the solid line represents the fit that is applied to the data.